Building Generative UI: How I Got an LLM to Design Native Interfaces
Most AI-powered apps treat the interface as a static container. The LLM generates text, and the app pours it into a pre-built screen. But if the model is smart enough to reason about data, why can't it also reason about how to present that data?
I built a system where Claude generates the entire UI layout at runtime — not as rendered HTML or a screenshot, but as a structured JSON tree that gets walked by a recursive renderer and turned into native SwiftUI or Jetpack Compose views. No hardcoded screens. Every response is a different interface, tailored to the question.
This post is a deep dive into the architecture: the DSL design, the recursive renderer, the agentic tool-use loop, the cross-platform parity system, and the error recovery that makes it all reliable enough to actually use.
System architecture
flowchart TD
    A[" User prompt "] --> B["ClaudeService\n(Swift Actor)"]
    B --> C{"stop_reason?"}
    C -->|"tool_use"| D["Execute Tool"]
    D -->|"tool_result"| B
    C -->|"end_turn"| E["JSON UINode Tree"]
    E --> F{"Valid?"}
    F -->|"Yes"| G[" UIResponse "]
    F -->|"No"| H["Diagnose Error"]
    H -->|"Retry (up to 2x)"| B

    D -.-> D1["filter_transactions"]
    D -.-> D2["aggregate_spending"]
    D -.-> D3["list_unique_values"]
    D -.-> D4["get_date_range"]

    G --> R1["NodeRenderer\n(SwiftUI)"]
    G --> R2["NodeRenderer\n(Compose)"]
    R1 --> V1["Native iOS"]
    R2 --> V2["Native Android"]

    style A fill:#fff,stroke:#1a1a1a,color:#1a1a1a,stroke-width:2px
    style B fill:#f0eeea,stroke:#999
    style C fill:#f0eeea,stroke:#999
    style D fill:#e8f4e8,stroke:#6a9
    style D1 fill:#e8f4e8,stroke:#b8d8b8
    style D2 fill:#e8f4e8,stroke:#b8d8b8
    style D3 fill:#e8f4e8,stroke:#b8d8b8
    style D4 fill:#e8f4e8,stroke:#b8d8b8
    style E fill:#f0eeea,stroke:#999
    style F fill:#f0eeea,stroke:#999
    style G fill:#e8f4e8,stroke:#6a9,color:#1a1a1a,stroke-width:2px
    style H fill:#fde8e8,stroke:#d88
    style R1 fill:#e8eaf4,stroke:#b8bad8
    style R2 fill:#e8eaf4,stroke:#b8bad8
    style V1 fill:#007AFF,stroke:#005ec4,color:#fff
    style V2 fill:#4CAF50,stroke:#388E3C,color:#fff
The problem
I was building an expense tracking app. The typical approach is to design a screen for each type of query: one for category breakdowns, one for merchant summaries, one for transaction lists, one for trend charts. Each screen has its own layout, its own data binding, its own edge cases.
But user questions are open-ended. "Compare my food spending to last month" needs a different layout than "show me all Starbucks transactions." You end up either building dozens of screens or cramming everything into one generic layout that doesn't serve any query particularly well.
What if instead of routing to pre-built screens, the LLM could design the screen itself?
The constraint that made it work
Swift doesn't support runtime code compilation. You can't have an LLM generate SwiftUI source code and eval it on the fly. And even if you could, the output would be too unpredictable — the LLM might produce code that doesn't compile, references nonexistent APIs, or creates layouts that crash at runtime.
The insight was to constrain the output space. Instead of generating arbitrary code, the LLM generates a JSON tree using a fixed set of node types. Think of it as giving the LLM a box of Lego bricks rather than a paintbrush — the pieces are predefined, but the combinations are infinite.
I designed a DSL with 14 node types:
Layout:     vstack, hstack, zstack
Content:    text, stat, image, badge, progress
Container:  card, list
Data viz:   chart (bar, pie, line), table
Utility:    divider, spacer
These are recursive — a vstack can contain a card which contains an hstack which contains stat and badge nodes. The LLM can compose arbitrarily complex layouts from simple building blocks.
The full response format looks like this:
{
  "title": "Food Spending",
  "layout": {
    "type": "vstack",
    "spacing": 12,
    "children": [
      {
        "type": "stat",
        "label": "Total",
        "value": "$214.50",
        "color": "orange",
        "icon": "fork.knife"
      },
      {
        "type": "chart",
        "variant": "bar",
        "title": "By Merchant",
        "data": [
          { "label": "McDonald's", "value": 54.49, "color": "red" },
          { "label": "Starbucks",  "value": 47.25, "color": "orange" }
        ]
      }
    ]
  },
  "spoken_summary": "You spent $214.50 on food this month."
}
Why 14 types and not 5 or 50? Fewer types would force the LLM into awkward workarounds (encoding everything as text). More types would increase the chance of the LLM hallucinating properties or confusing similar components. Fourteen hits the sweet spot: rich enough to express financial dashboards, constrained enough that the LLM almost always produces valid output.
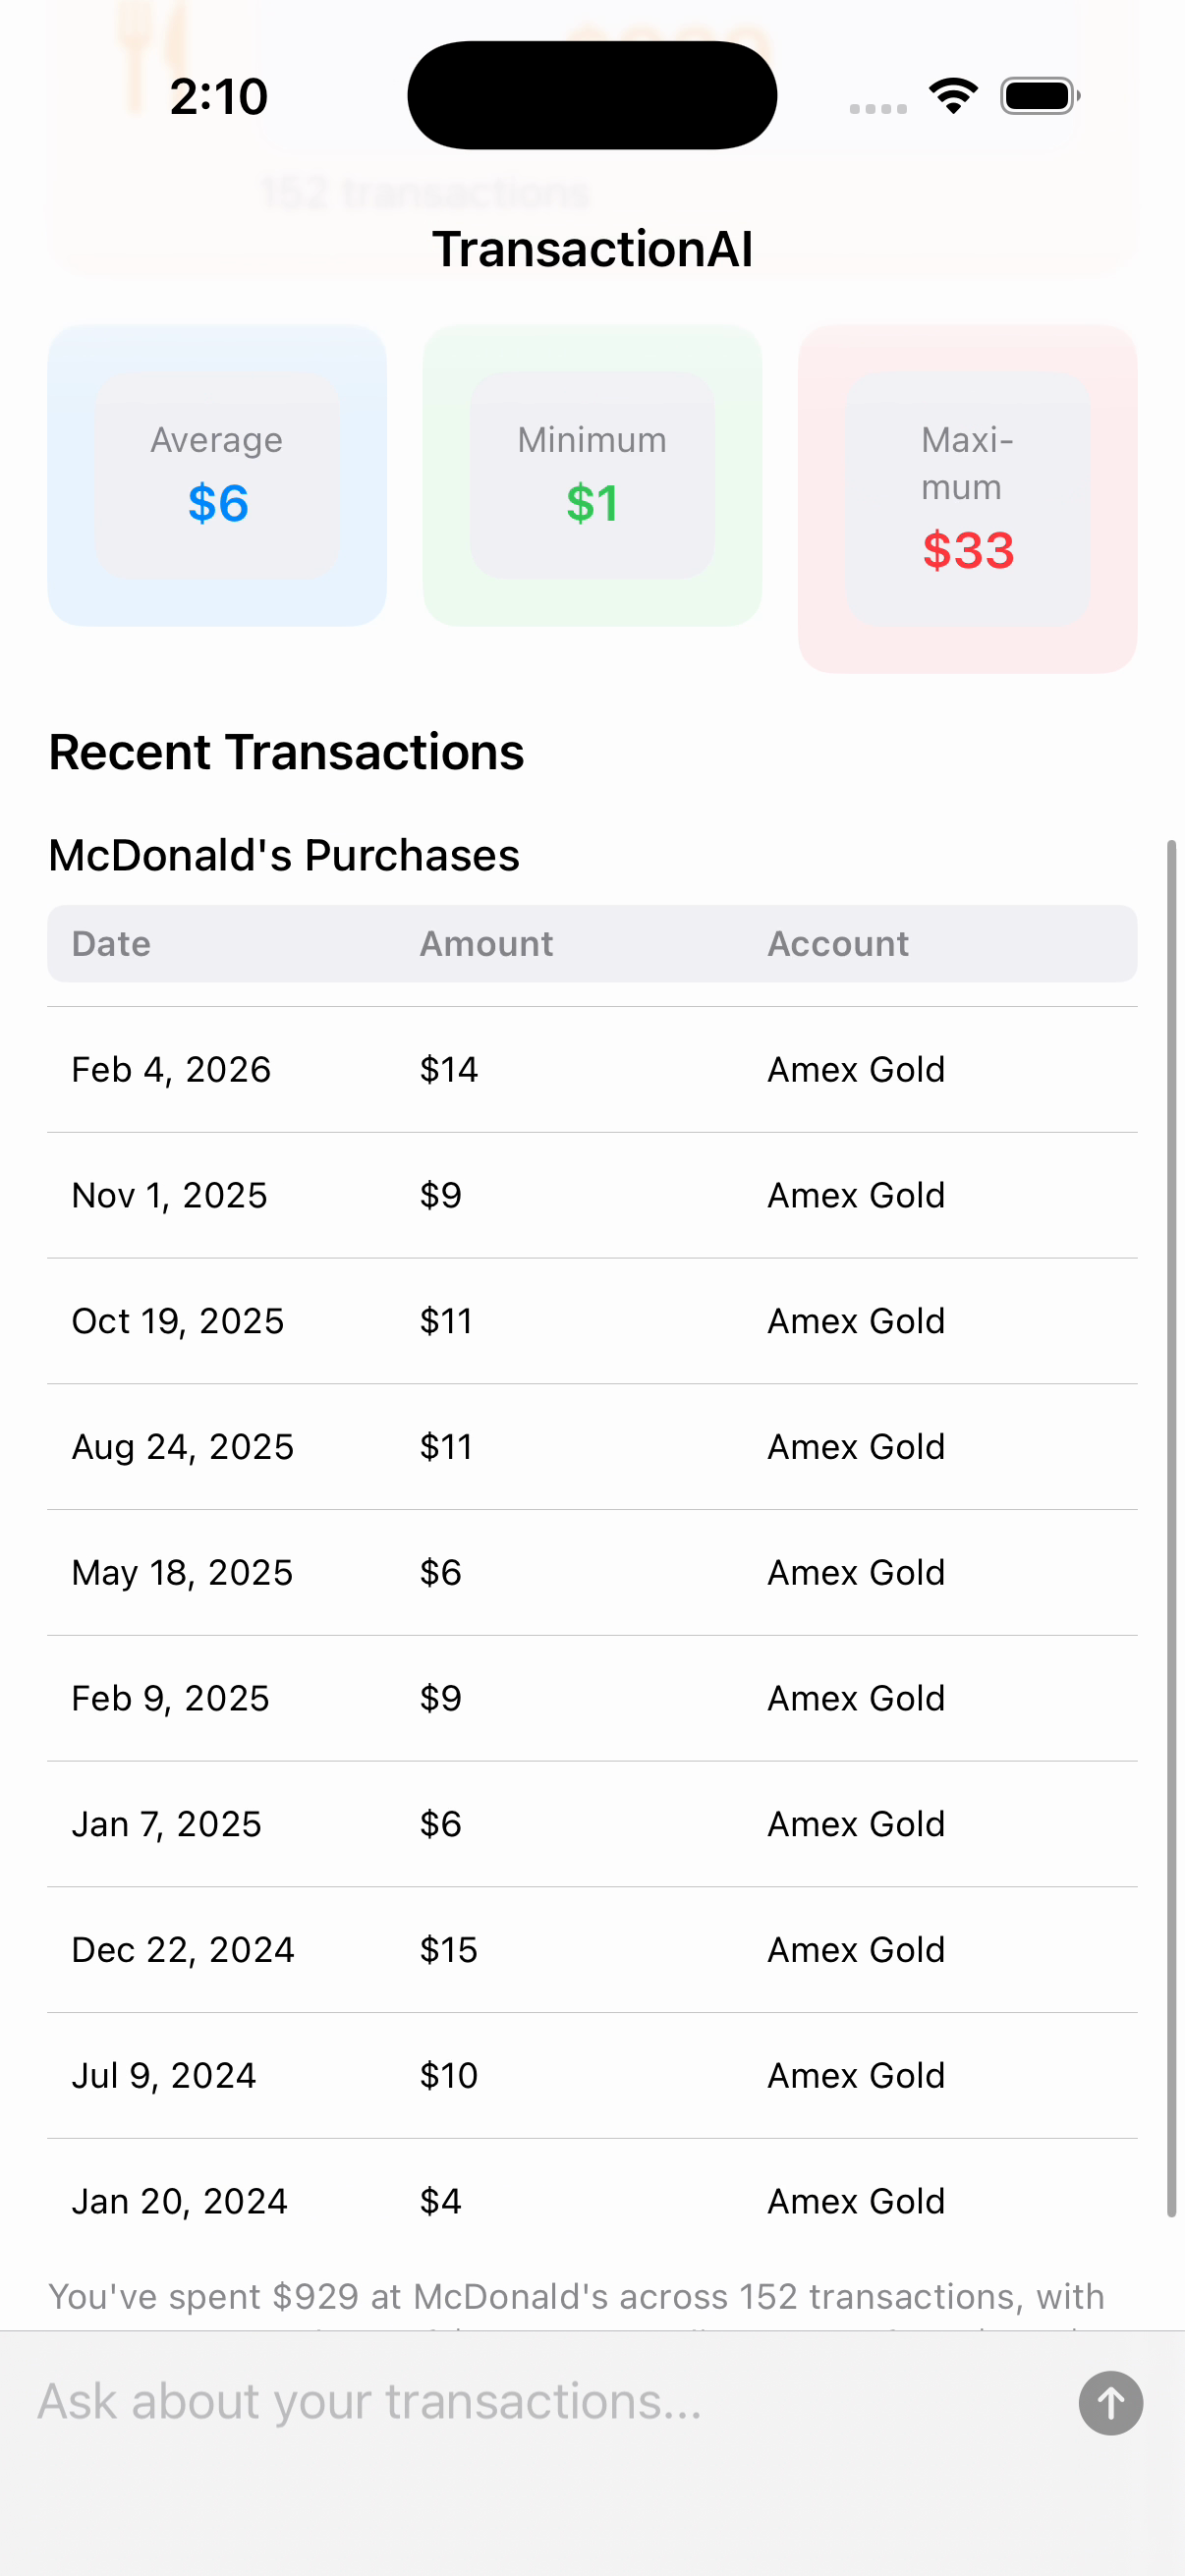
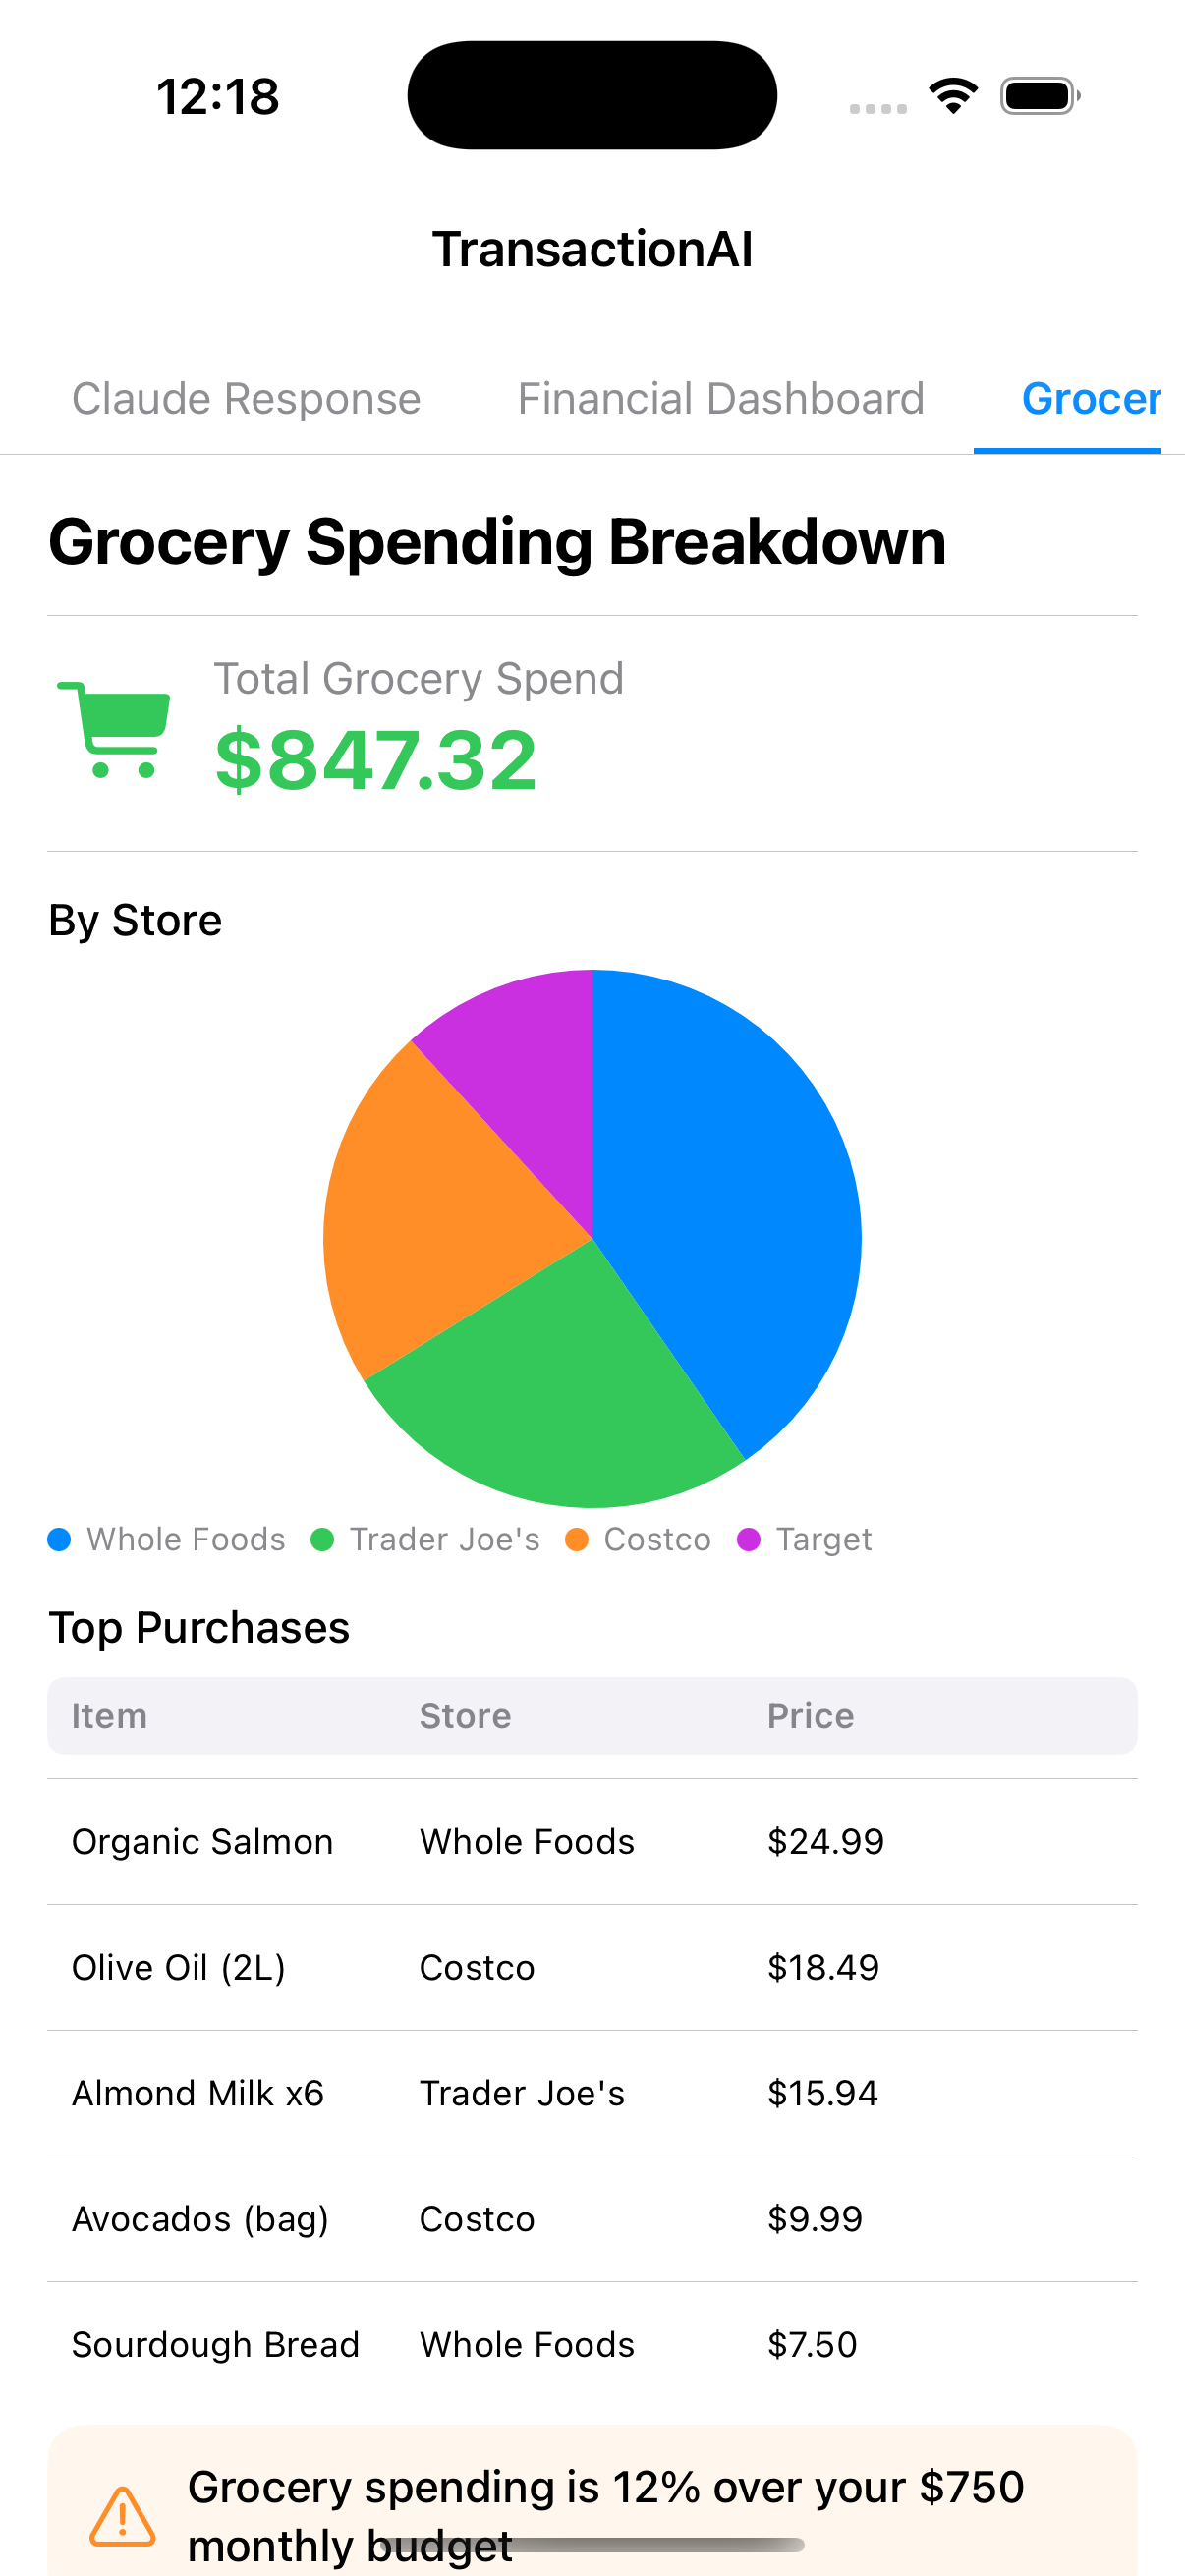
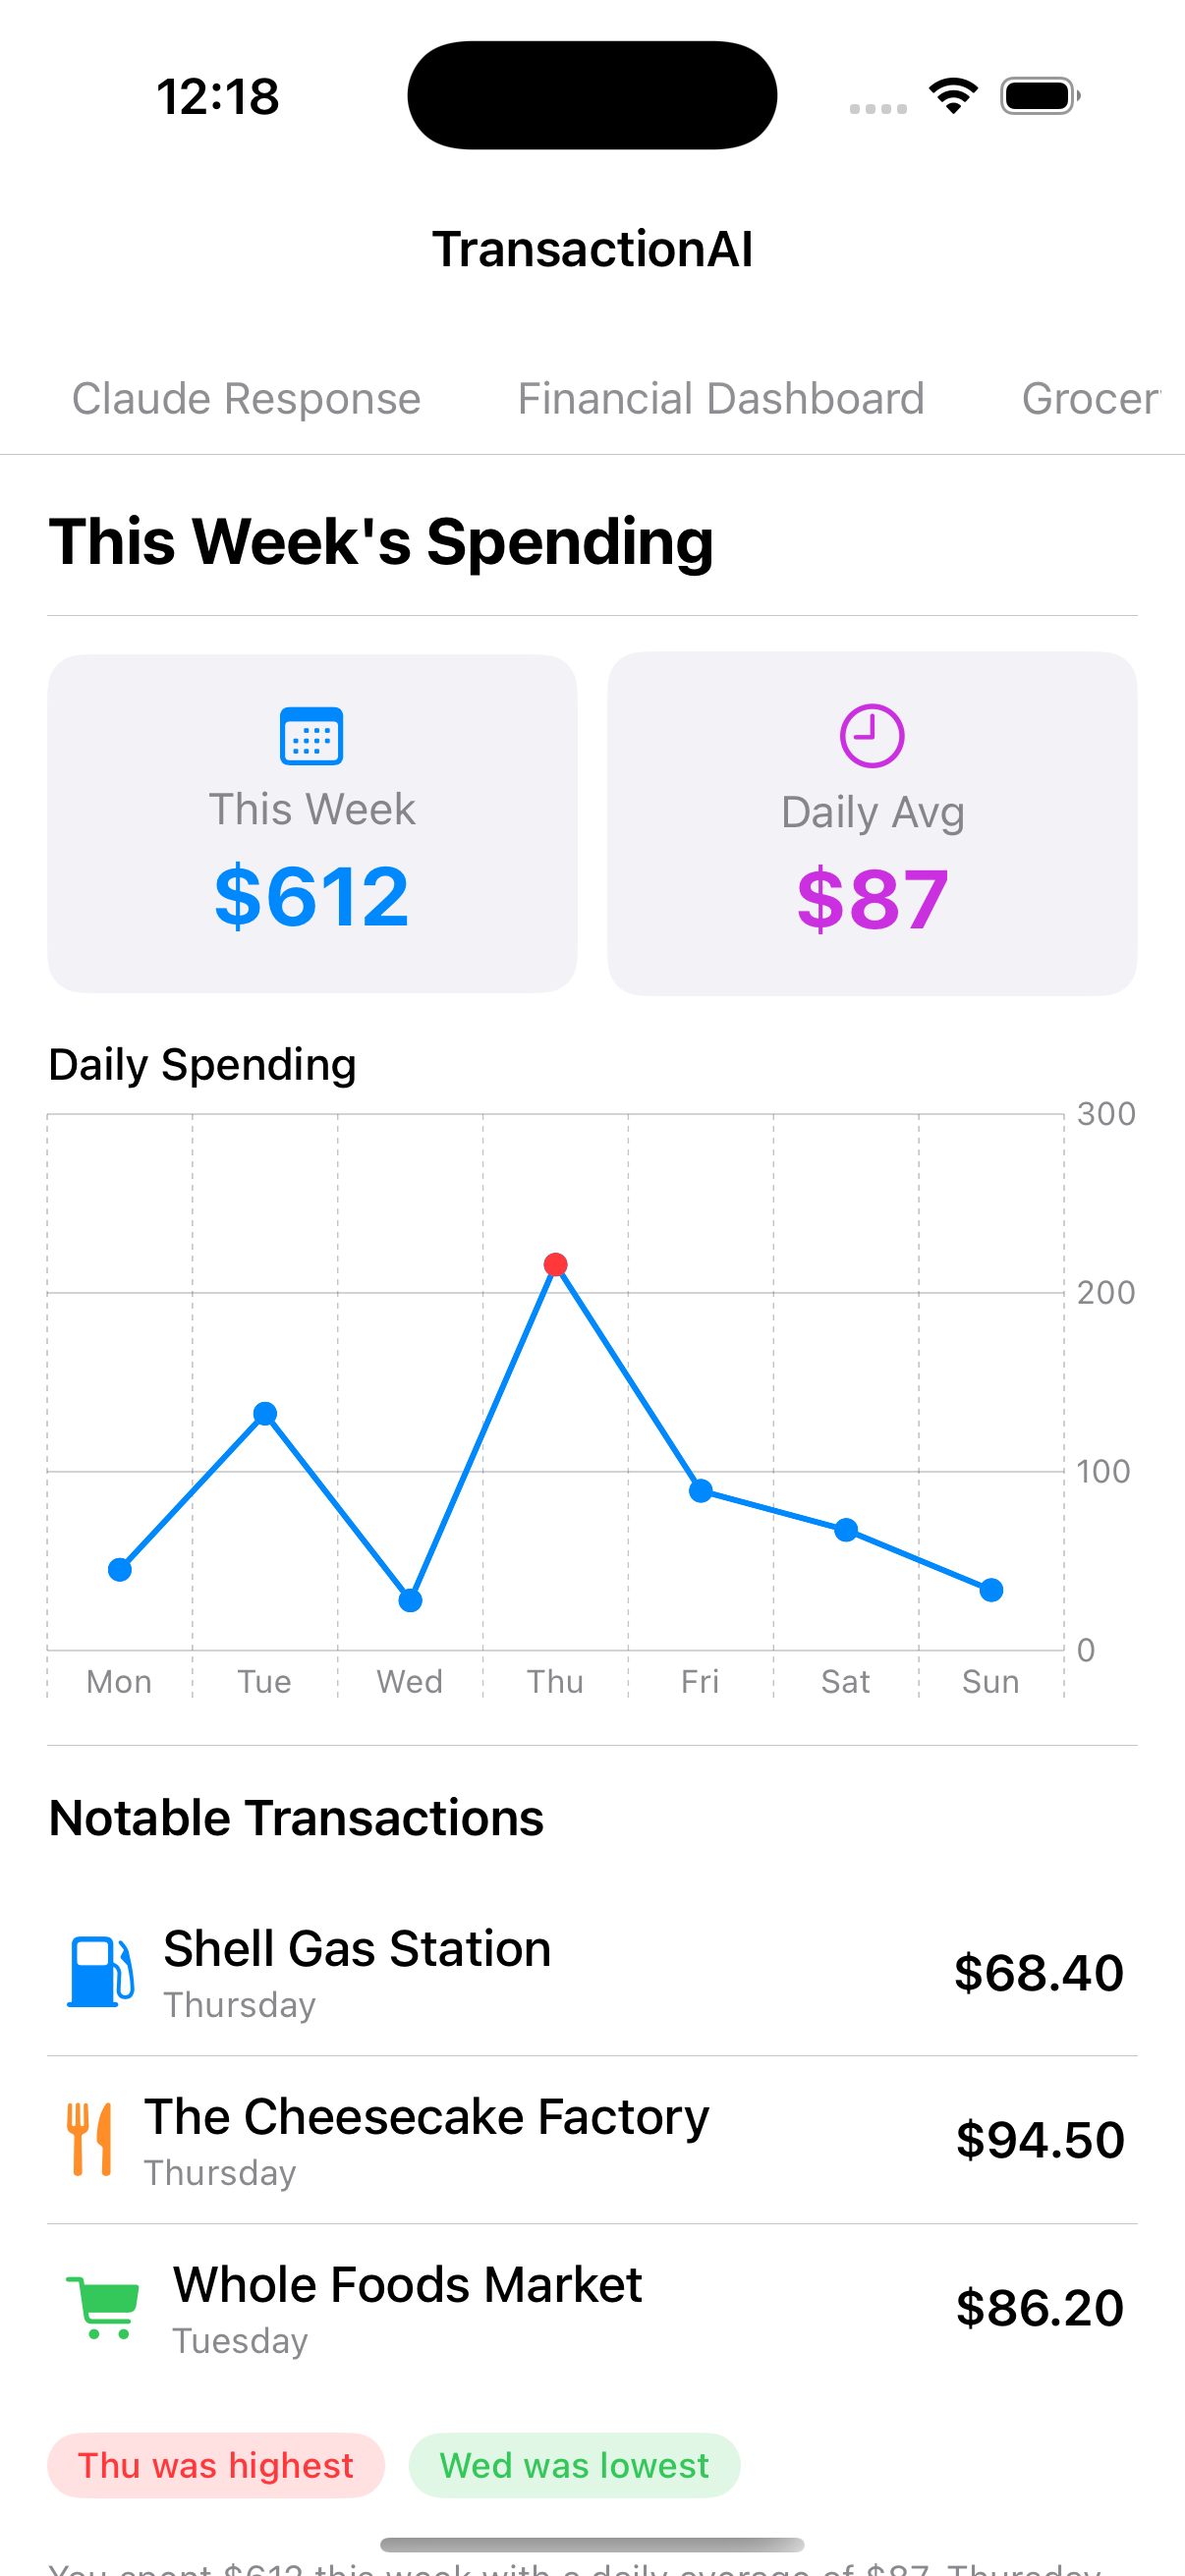
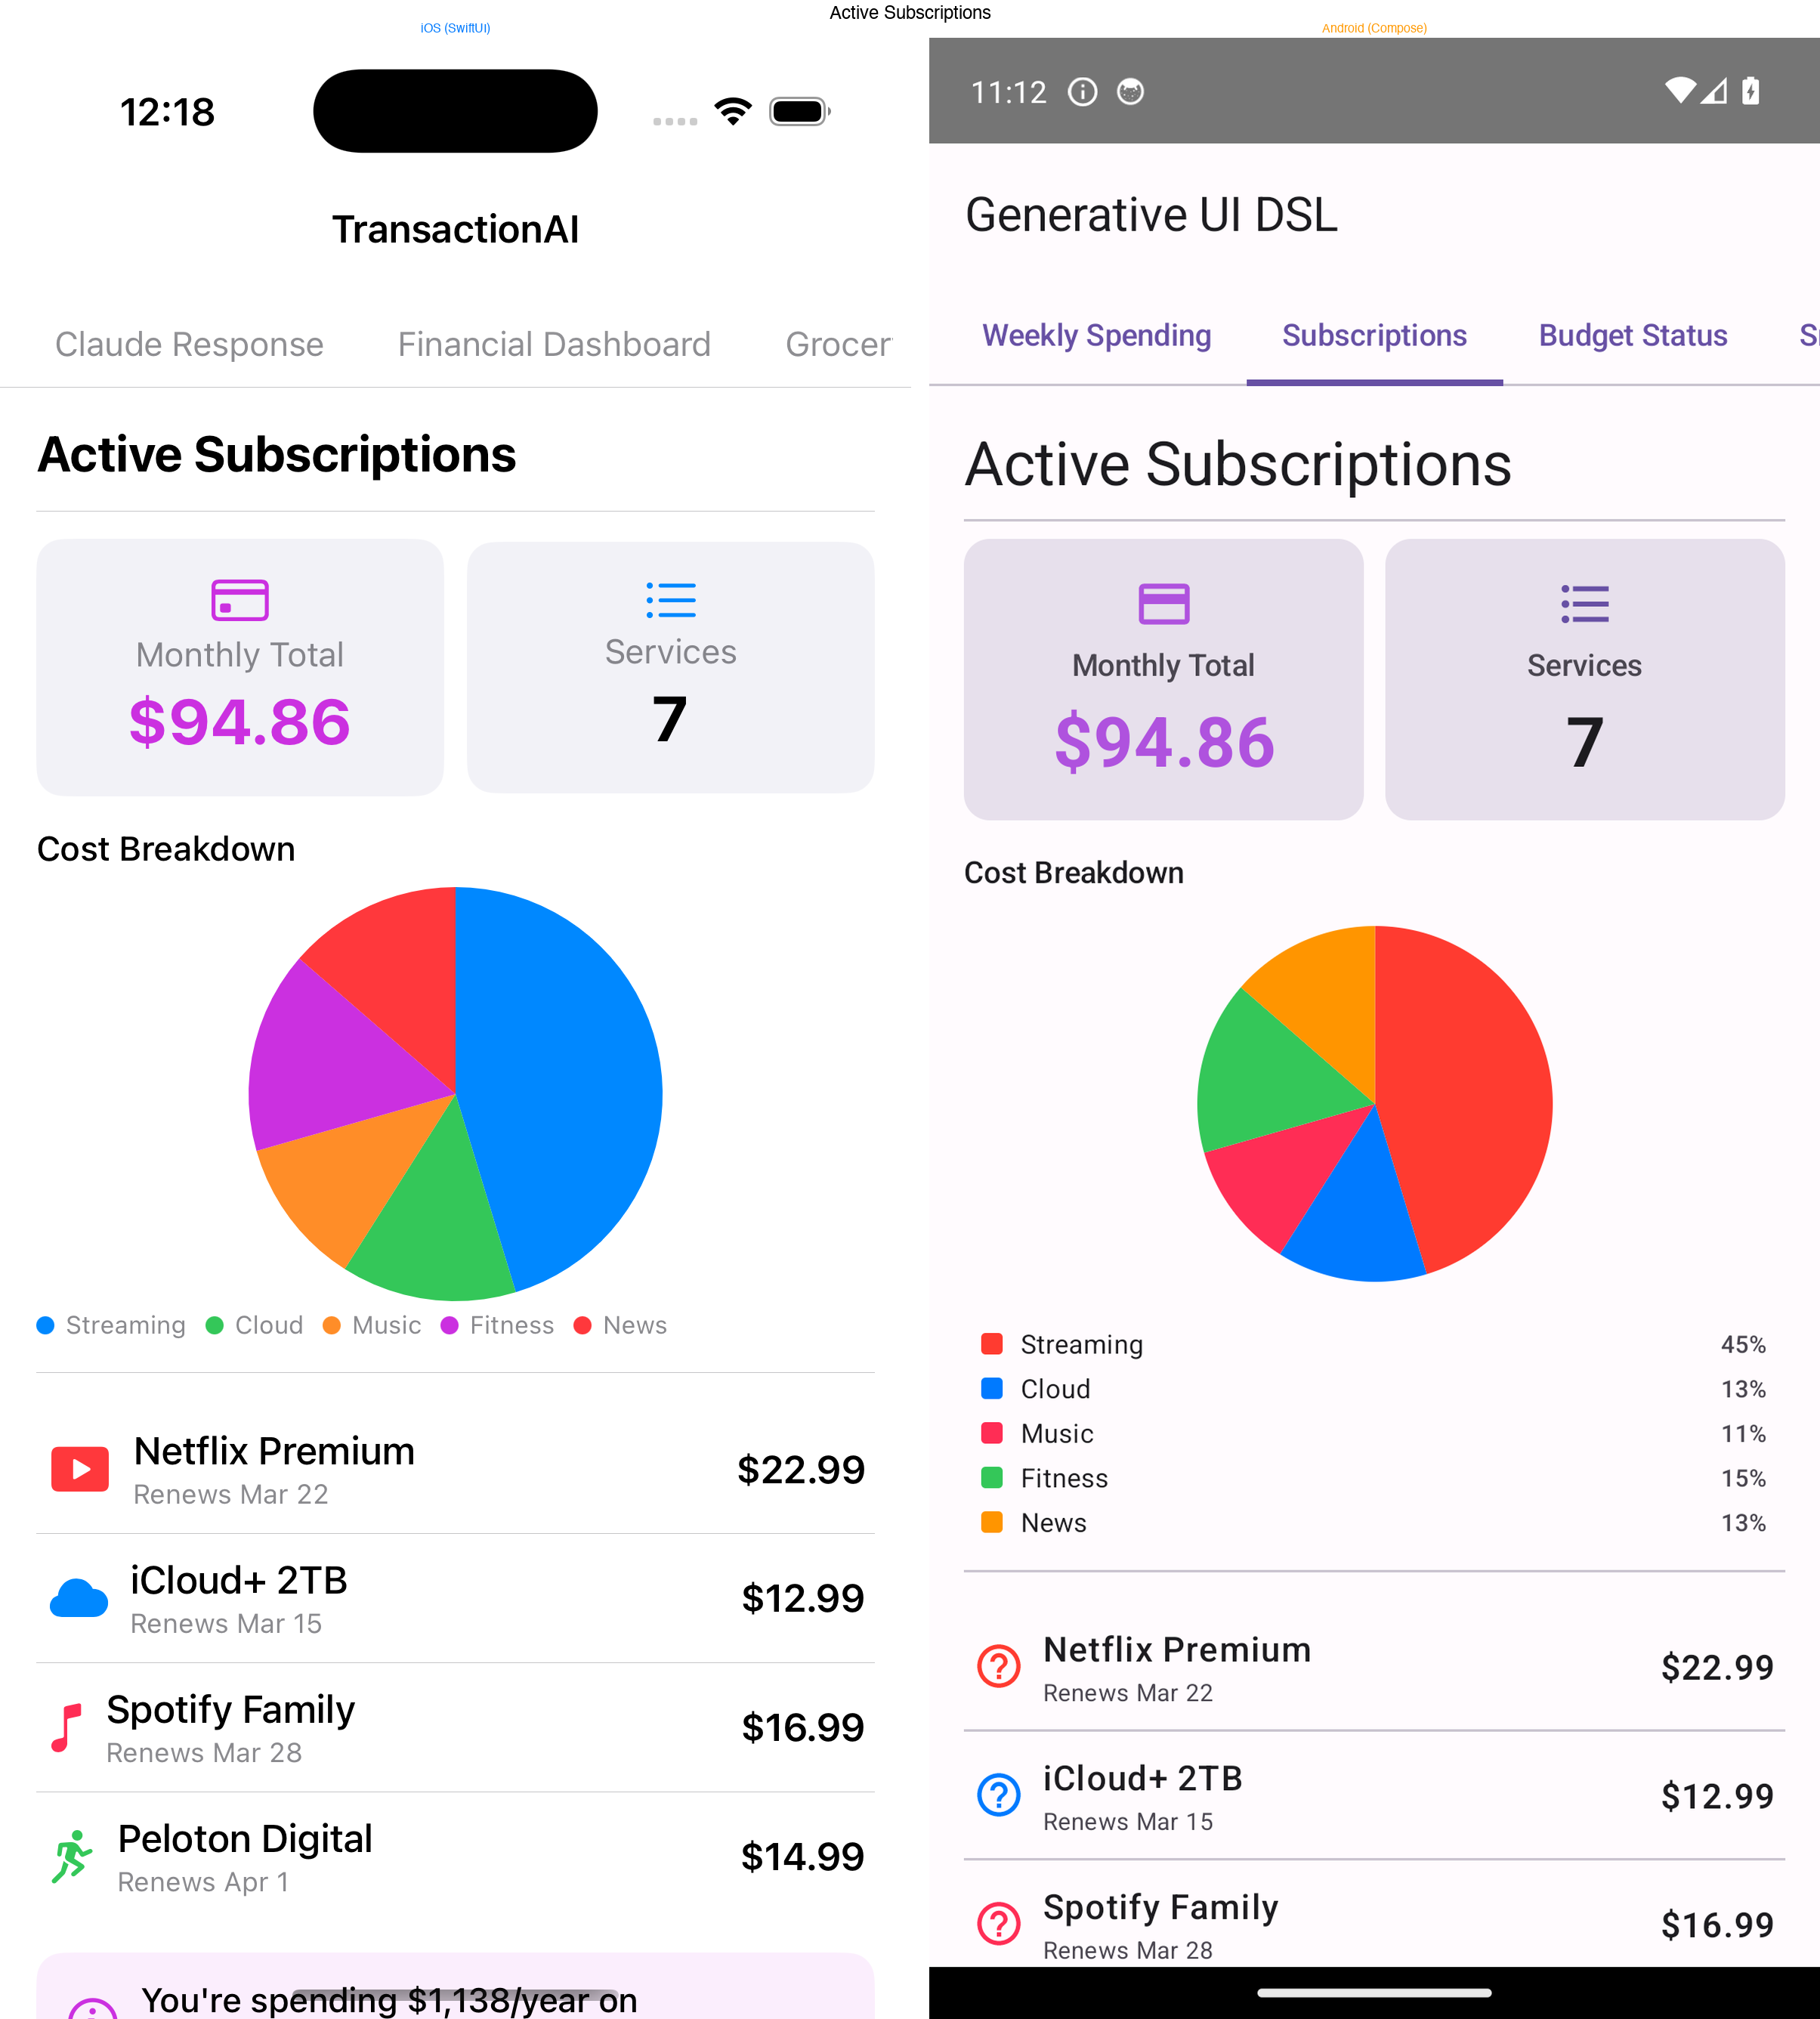
Here's what that flexibility looks like in practice — every layout below was generated by Claude from a different question, using the same 14 node types:
The recursive renderer
The renderer is a single recursive SwiftUI view. It pattern-matches on the node type and delegates to the appropriate view builder:
public struct NodeRenderer: View {
    public let node: UINode

    public var body: some View {
        switch node {
        case .vstack(let n):  vstackView(n)
        case .hstack(let n):  hstackView(n)
        case .card(let n):    cardView(n)
        case .chart(let n):   chartView(n)
        case .stat(let n):    statView(n)
        case .text(let n):    textView(n)
        // ... 14 cases total
        }
    }
}
Layout nodes recurse by rendering their children as NodeRenderer instances:
private func vstackView(_ n: VStackNode) -> some View {
    VStack(alignment: .leading, spacing: n.spacing) {
        ForEach(n.children) { child in
            NodeRenderer(node: child)
        }
    }
}
This is the entire rendering engine. SwiftUI's declarative nature means the recursive walk naturally composes — a vstack with a card containing an hstack of stat views just works, because each level returns a View and SwiftUI handles the rest.
The data model uses Swift's indirect enum to represent the tree:
public indirect enum UINode: Codable, Identifiable {
    case vstack(VStackNode)
    case hstack(HStackNode)
    case zstack(ZStackNode)
    case text(TextNode)
    case stat(StatNode)
    case chart(ChartNode)
    case card(CardNode)
    case list(ListNode)
    case table(TableNode)
    case image(ImageNode)
    case badge(BadgeNode)
    case progress(ProgressNode)
    case divider(id: String)
    case spacer(id: String)
}
Decoding uses a custom init(from:) that reads the "type" field and dispatches to the appropriate case. Unknown types are gracefully ignored rather than crashing the whole layout.
The agentic layer
A UI is only as good as the data behind it. Early versions passed the entire CSV of transactions in the system prompt, but this hit token limits fast and meant Claude was guessing at aggregations rather than computing them.
The solution was tool use. Instead of giving Claude all the data upfront, I gave it four tools to query the data programmatically:
get_date_range      → { earliest, latest, total_transactions }
list_unique_values  → [{ value: "Food & Drink", count: 203 }, ...]
filter_transactions → { transactions: [...], total_matching: 42 }
aggregate_spending  → [{ group: "Food", total: 1234.50, count: 89 }, ...]
Claude orchestrates these in a multi-round conversation. A typical flow for "compare my spending by category" looks like:
Round 1: Claude calls get_date_range
         → learns data spans Jan 2024 - Dec 2024, 847 transactions

Round 2: Claude calls aggregate_spending(group_by: "parent_category")
         → gets totals per category, sorted by amount

Round 3: Claude calls end_turn
         → generates a UINode tree with a bar chart, stat cards,
           and a summary table — using the actual numbers
The agent loop runs for up to 10 rounds. Claude decides when it has enough information and produces the final JSON layout. This means the UI is always grounded in real data — Claude doesn't hallucinate numbers because it computed them via tool calls.
The implementation uses a Swift actor to manage the conversation state:
for _ in 0..<maxToolRounds {
let response = try await callClaude(
systemPrompt: systemPrompt,
messages: messages,
tools: tools
)
if response.stopReason == "tool_use" {
// Execute each tool, append results to conversation
for block in response.content.filter({ $0.type == "tool_use" }) {
let result = try queryService.executeTool(
name: block.name, input: block.input
)
toolResults.append(["type": "tool_result", ...])
}
messages.append(["role": "user", "content": toolResults])
} else {
// end_turn — parse the JSON response as UINode tree
return try await decodeWithRetry(json: extractJSON(response))
}
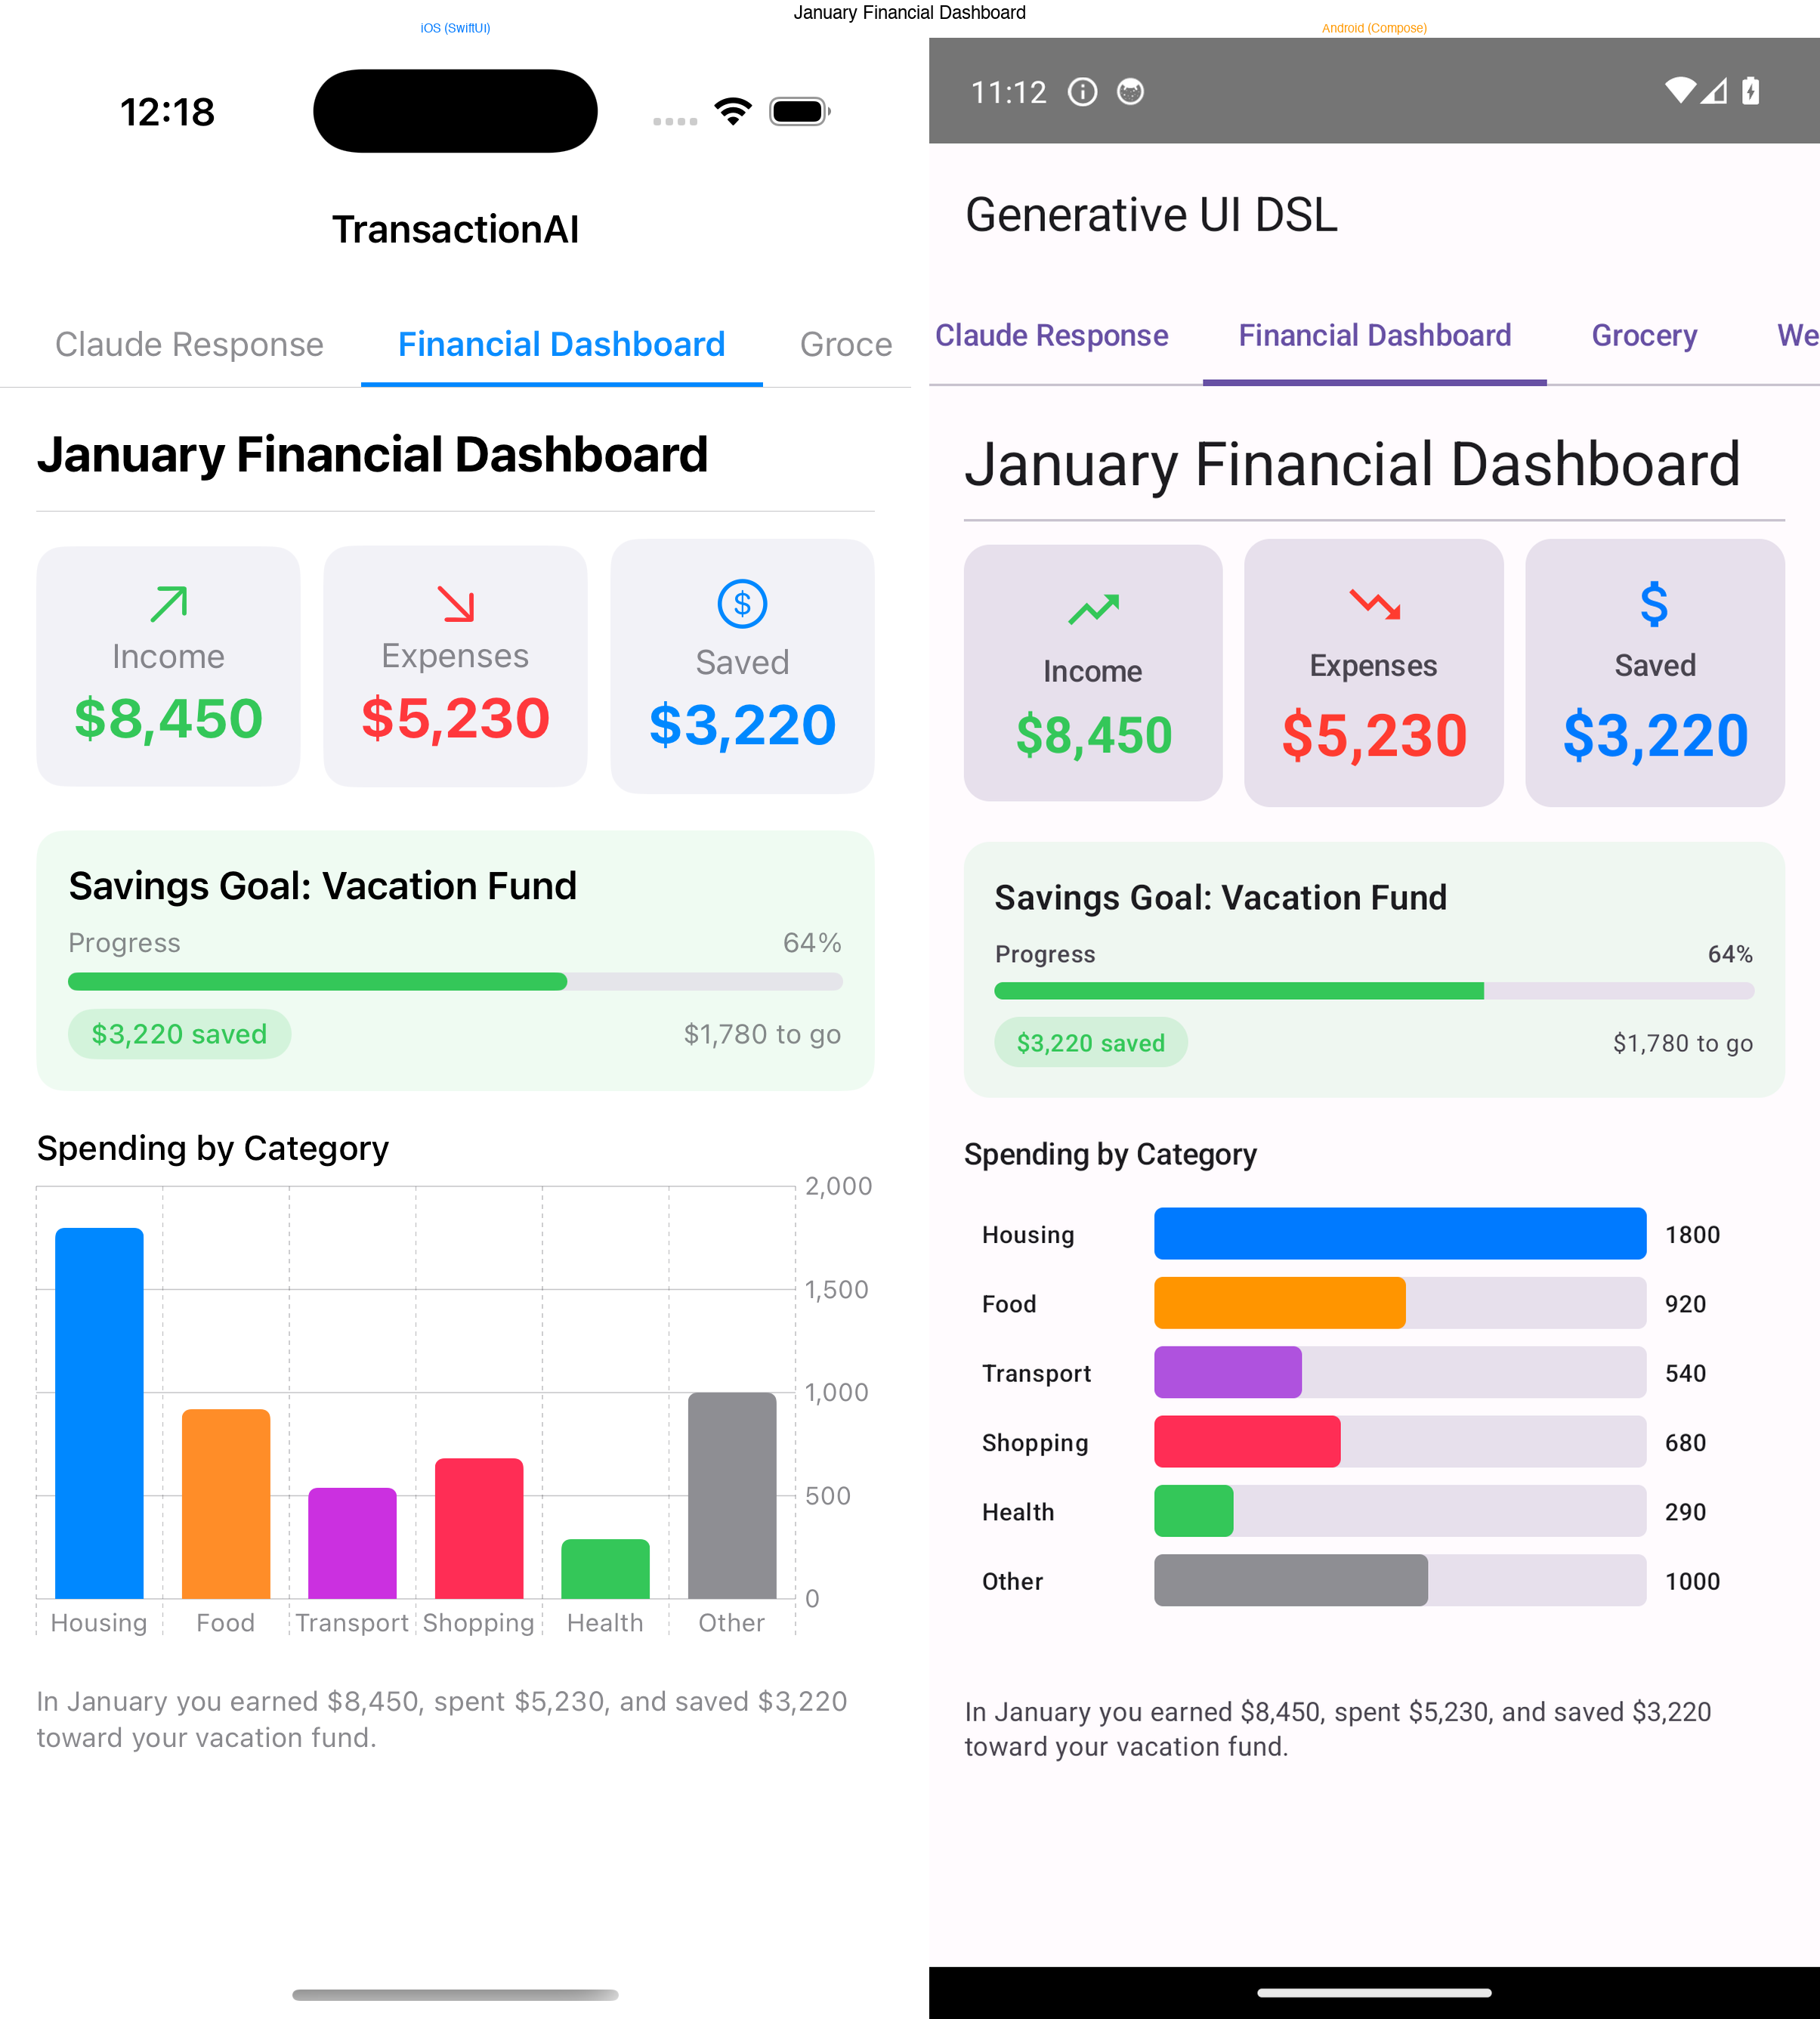
}Making it cross-platform
The DSL is platform-agnostic by design — it's just JSON. So I built renderers for both SwiftUI (iOS) and Jetpack Compose (Android) that consume the exact same input.
The challenge is verifying parity. "Looks similar" isn't good enough when the same JSON should produce structurally identical layouts. I solved this with render snapshot testing:
- Each platform has a
RenderSnapshotutility that serializes a rendered node tree into a canonical text description - Golden snapshots live in a shared
spec/test-snapshots/directory - Both Swift and Kotlin test suites verify their output matches byte-for-byte
This catches structural divergence immediately. If the Kotlin renderer handles a chart node differently than the Swift one, the snapshot test fails.
Icons were another parity challenge. iOS uses SF Symbols (fork.knife, chart.bar) while Android uses Material Icons. I maintain an icon-map.json that maps between the two systems, and the Android renderer looks up the Material equivalent at render time.
The architecture for the shared spec:
spec/
├── generative-ui-dsl.schema.json   # JSON Schema v2020-12 (source of truth)
├── icon-map.json                   # SF Symbols → Material Icons
├── test-fixtures/                  # 17 JSON inputs (shared by both platforms)
│   ├── simple_text.json
│   ├── financial_dashboard.json
│   ├── malformed.json
│   ├── unknown_type.json
│   └── ...
└── test-snapshots/                 # Golden outputs (must match on both platforms)
    └── *.txt
Error recovery
LLMs don't always produce valid JSON. Sometimes there's a trailing comma, a missing field, or an enum value the schema doesn't recognize. In a traditional system, this crashes the app. In a generative system, you can ask the LLM to fix its own mistakes.
The error recovery works in three stages:
- Decode with diagnostics — attempt to parse the JSON, capturing not just pass/fail but specific issues (missing required field, wrong type, unknown enum value)
- Build a correction prompt — send the original JSON back to Claude along with the specific error details and ask it to fix the response
- Retry — decode the corrected response, repeat up to 2 times
The key insight is giving Claude diagnostic context, not just "your JSON was invalid." The correction prompt includes the exact decoding error, the field that failed, and what was expected. This is the difference between "try again" (which often produces the same mistake) and "field variant must be one of bar, pie, line — you used horizontal_bar" (which Claude fixes immediately).
In practice, the first attempt succeeds about 90% of the time. The retry catches most of the remaining 10%. Complete failures are rare.
What I learned
Constraints improve LLM output. Giving an LLM a blank canvas produces unpredictable results. Giving it a well-defined grammar with clear types produces output that's creative and reliable. The 14-node DSL is less expressive than arbitrary SwiftUI, but that's the point — it's expressive enough for the domain while being constrained enough that the LLM stays within bounds.
Tool use changes the quality of generated UI. When Claude guesses at data, the layouts are generic. When it queries real data through tools, it designs layouts around the actual shape of the results — choosing bar charts for comparisons, tables for detailed listings, stat cards for single metrics. The UI is more thoughtful because the model has more context.
Cross-platform parity is achievable with snapshot testing. I was skeptical that SwiftUI and Jetpack Compose could produce equivalent layouts from the same input. The snapshot testing approach made it practical — you define "equivalent" as a canonical tree description, and the tests enforce it mechanically.
Error recovery should be conversational. Rather than building a complex JSON repair system, just ask the LLM to fix its own output. It already understands the schema (it just generated the response). Giving it specific diagnostic feedback makes the correction loop almost always succeed on the first retry.
Try it yourself
Both repositories are public:
- Generative UI DSL — the cross-platform framework (Swift Package + Kotlin library, JSON Schema spec, 17 test fixtures)
- Expenses AI — the iOS app with agentic tool use and the full rendering pipeline
The generative UI pattern isn't limited to expense tracking. Any domain where user queries are open-ended and the ideal presentation varies — analytics dashboards, health data, content management, customer support — could benefit from letting the model decide how to show the answer, not just what the answer is.